In my past postings, where we configured a lan2lan vpn between a fortigate and juniper-SRX, this is a continuation on t-shooting.
If you are familiar with the webGUI, you will have ran across this ipsec-monitor at some point and time.
Okay, so what do we do and what do we look at, while trouble-shooting ipsec vpns?
In this blog, we will look at a few various means for the diagnostics of VPN problems. This post is for troubleshooting vpn-tunnels created in a interface-mode ( aka routed vrs policy ) & those using PSK for peer-authentication.
PHASE1
We will now look at some of the troubleshooting and show commands, that can be executed on a fortigate to help diagnose vpn problems.
1st, I want to state,
90% of the problems with these VPNs can be traced back to a mismatch in our configurations. So always double check your configurations, and this mean all aspects of the configurations.
e.g
- Your Pre-Shared-Key or Certificate
- IKE proposal ( 3des md5/sha1/sha256 or whatever your using )
- IPSEC proposal ( 3des md5/sha sha256 or whatever your using )
- peer address ( is it correct , is it the correct interface )
- expected identification ( FQDN or ip_address or Hybrid )
- fwpolicies
- route reachability
- etc.......
The very 1st common error encountered, typically pertains to our PSK key entries; "
be cautious of any leters, numbers, lower and uppercase". These are simple to spot in the logs, due to we commonly see "mis-match pre-shared-key" or something to that nature. So always re-key if you believe the PSK is not correct. This is probably 99.99% of the problems that prevent phase1 setup.
Using the combination of the following cmds;
- diag debug app ike filter name "phase1-name"
- diag debug app ike -1
- diag debug enable
Will always give you clues to any PSK and other proposal issues;
here's a possible mis-match within our PSK;
Moving on, when the PSK has been confirmed & is correct, then the next most common problem develops around the initial proposals that's being offered between both parties.
I (
just me personally ) do not like to deploy multi-proposals. It's not required, can cause confusion by some various remote-vpn devices. Unless it's a dynamic-vpn, you DON"T NEED MULTI proposals. Yeap, I'll re say it here again,
YOU DON'T NEED MULTI PROPOSALS in a site2site vpn
.
Once again the
diag debug app ike will show you both yours, and theirs proposals, & what's being present by both parties. There has to be a match and agreement before phase1 can ever become established.
e.g ( spotting a mis-match proposals blue is the far-end and what they sent and purple is what I have configured )
NOTE:
With a packet capture only, you will also notice very little traffic after the initial connection from the initiator & responder ( why would 2 vpn appliance attempt any further communication if the keys don't match ? or the proposal didn't agreed in the 1st place )
So even without logging, you can follow the ip datagrams and determine if it's a possible PSK issue exists, & by looking at the ip datagrams from a packet capture. I always suggest doing this ( packet capturing ) for a few other reasons;
- You can validate the peers ip_address that are configured
- are they negoiating via NAT transversal
- confirm that no ACLs are blocking traffic between peers
Next, you need to be aware of IKE and that it uses src_port #500/udp and dst_port #500/udp unless we are being NAT. If NAT-transversal ( aka NAT -T ) is involved, the dst_port becomes #4500/udp.
The integral diag sniffer will expose problems if the initiator or responder are not being reached or fail to respond
e.g ( cmdline using wan1 interface )
diag sniffer packet wan1 "udp and dst port 500"
or
diag sniffer packet wan1 "udp and st port 4500"
Next, once you have confirmed the PSK and initiator/responder are talking, than we want to ensure the IKE +IPSEC proposal are matching.
With the IKE+IPSEC proposals, the authentication proposal has to match, and the
Diffie-Hellman group must match. This determine the key strength during the negoiation of the peers over a unsecured channel.
Why such a big harp on proposals and mis-match?
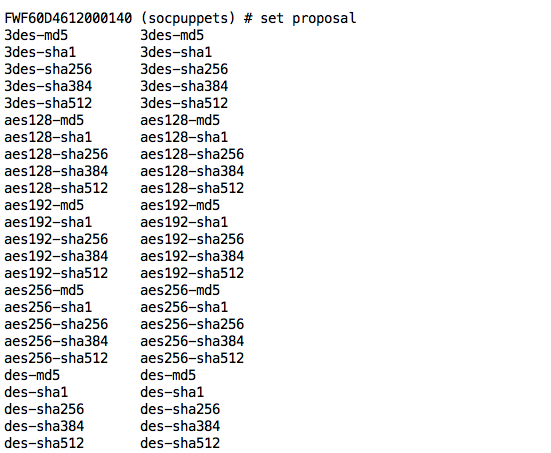
Will look at just how many proposals that a modern Fortigate Appliance running 5.0.X software supports;
What this means? That's a lot of @$#$% proposals.
Even a juniper or cisco don't support ALL of the listed proposals. Even some firewall have proposals, that even a fortigate don't support.
e.g
Juniper SRX supports both, PSK and RSA/DSA signatures certificates, where-as a Fortigate supports only PSK and RSA
Juniper SRX supports md5 , sha1 and sha256, where-as a fortigate support all of these and sha 364, 512
Linux's Strongswam support twofish and blowfish ciphers, both of which are not part of a Fortigate lingo or supported ipsec ciphers by commercial firewall that I know of
Until recently, cisco firewall didn't support IKEv2, where-as fortigate has had ikev2 support for probably 7+ years or more if I had to guess
Some cisco routers support cisco-only cipher available with cisco routers or phase1 authentication methods that could be totally different.
Eg
here what a cisco firewall support ( crack, rsa-sig,psk );
yes Crack :)
Eg
a common cisco router ;
Next ( this is
VERY VERY VERY IMPORTANT PAY ATTENTION! )
" The Phase IKE SAs keylife should always match, and be pretty darn close at it! "
A mis-match here , will typically not be a show-stop within the initial setup for our phase1 security-association, but the 2 ends not matching, will cause interruptions and problematic issues upon re-keying.
This is due to the keylife expiring out on one vpn device, while the other side still think it's all is good.
NOTE: DPD and ike-keepalive ( similar but they are not the same ) can help with regards to remote-peers & detection of a failure in connectivity.
Take this SRX and FGT, one party has the keylife set to an exaggerated
120sec ( FGT ) and the other to
180sec ( SRX ). That's the two lowest values that support by these firewall devices btw
Look at what happens when we ping across the vpn tunnel & when we have a mis-match in IKE keylife ?
One last items about phase1 trouble-shooting
If NAT-T is involved, you might need to pin the PAT/NAT session table, or use some of kind of NAT-T keepalive to avoid the expiration of your PAT/NAT translation.
What this means; " if the NAT-T session is maintain by a NAT'ing device such as a cisco router , an upstream firewall, or some other network translation device", any traffic that's does not maintain a certain interval, could cause the IKE session to get hung up and stale. The NAT-T keepalives prevents this from happening.
You can enable NAT-T support,. by each per-peer under your fortigate configurations for phase1 ;
e.g
NAT-T support is passed along during the IKE phase1 negotiations between peers, if they both support it.
Let's look at another diag debug output from a fortigate "
diag debug app ike 255 ";
Here's we can see the output shows a phase2 proposal mis-match and it's clearly indicated by the above output & using the "
diag debug app ike " command.
Let's look at some more diag vpn outputs. One of the most important option within fortigate diagnostics is our phase1 filters. In a hub or a service provider arena, you might havd a dozen or more vpn-tunnels. It's not at all uncommon to see 100-1k vpn-ipsec-tunnels nailed to a fortigate.
NOTE: Use the filtering option at your hub vpn-device, to avoid the over-saturation of diagnostics outputs & filter on the gateway of interest
Here a listing of my vpn tunels. It provides good basic information on any IKE and IPSEC SAs, uptime and peer information. If DPD was enabled we would have DPD details.
and for comparison, here's an active VPN I have where dpd is enabled & on just one side;
So sometimes we can quickly find out if both parties are using DPD, and if we are going across a NAT-d connection via the remote/local peers destination ports of 500/udp vrs 4500/udp.
NOTE: DPD DOES NOT NEED TO BE ENABLE BOTH WAY for a vpn tunnel to work, but it should be enable mutually imho.
For negotiation, either parties can negotiate the Phase1 SA, But let's say you don't want to do this or maybe your a passive vpn-termination device like those that I worked within a a few 3 letter gov agencies sub-contractors in the past.
Will have no fear, we can tell your device to never initiate the connection;
The above two screenshots stacked one on top of the other, shows the Juniper/SRX being the initiator and the Fortinet/Fortigate acting as a responder.
PHASE2
Now let's say we think we have our IKE SAs established, but we are still having problems, remember the quickmode selectors ( aka QM or Proxy-ids ) ? They have to match for both parties & for the IPSEC-SA that are establish under phase2.
Here's our configuration for the FGT<>SRX using a static defined proxy-ids.
NOTE: The local and remote subnets where defined. If you should build your phase2 configuration like this & between all devices, than you will never have a phase2 proxy-id mismatch imho. Also if you should happen to change the device on one end to another vpn-hardware appliance, you will not have to any changes to make on your fortigate vpn configuration.
But in reality, fortinet made a easy button, & that has been a source of many major problems & confusion.
By default the proxy-ids are defined as 0.0.0.0/0:0 for both the dst and src subnets:protocol. But this would not work for 99.99% of the vpn-tunnels that terminates to a non Fortigate VPN appliance device.
Yes, try a QuickMode selector of 0.0.0.0/0:0 to a; cisco ASA/Router, Strongswan, Pfsense, Checkpoint, etc.....
Your tunnel will not come up ( period ).
Okay we know the easy button does not fit all applications, and does not fit all vpn-appliances. I only recommend the 0.0.0.0/0:0 quickmode selectors, when you have a only-Fortigates on the other end of the vpn-tunnel and you have multiple of networks that you are carrying over the vpn-tunnel.
In reality, I almost never do this and prefer to build my phase2-interface SA per dst/src subnet and let me tell you my logic why?
When you build multiple ipsec-phase2 SA, and define each local/remote subnets details, you get statistics per each IPSEC-SA. This can help you with your diagnostics of why a SA number ### does not work , or what direction ( remember SA are uni-directional )
Take this design;
With the above method#1 and #2 & static defined SAs, we will have statistics & for 2ea SAs, using our diagnostic commands.
And now for some diagnostics output for review;
As you can clearly see, the 2nd proxy-id name
srx-p2-1 is not encrypting any data. (
see the text above for our redline underline? )
If you had used method#2 & the one single 0.0.0.0/0:0 define for both src/dst, it would not have been easy to determine the above problem.
PFS the what and why
PFS is one of those configuration items, that can cause a whole heck of problems. Will have no fear, make sure if you enable it on one vpn-peer, that the other peer also has it enabled. What PFS does in short, is to initialize the IPSEC-SA from a key sessions that's not generated from the parent key within the IKE SA.This provides more tighter security against any compromised ike keys.
Keep in mind that with PFS enabled, your ipsec SAs could use a completely different encryption schema and ciphers from that of the phase1 IKE. What that means, you could enable 3DES+grp5 for IKE phase1 and AES128+grp14 for the IPSEC SA phase2.
A complete lack of any connectivity at our phase 2 ipsec SAs, could very well be a mismatch in your IPSEC proposals, or worst you have one SA encrypting data and the other side not de-encrypting or vice-versa. These are hard to identify without mutual eyes, and troubleshooting from both end of the vpn via the firewall engineers. BUT the
diag vpn tunnel list , does shed some light into these types of problems.
Moving on,
When the tunnel are up, we have a useful means for gathering statistical data ( the number of packet encrypted/decrypted, SPI identifier , bytes sent/received ) via the "
diagnose vpn tunnel list " command and by following the output. This command is always my
1st command issued, while trouble-shooting vpn diagnostics problems.
One last things that comes up, a VPN ipsec-tunnel has some overhead. So a 1500 byte MTU is not going to fit with the overhead of the ESP-header, including the additional ip_header,etc.......
Unix offers the means to test max MTU size by using the DontFrag option and slowly increasing pings with the DF bit set to "1", at some point of the pings failing, this would be your max MTU.
e,g
ping -D ( macosx ) or ping -M ( linux ), for windows you have a few utilities out that accomplish the same
Conducting packet captures at the src/dst subnets can validation the TCP max-segement size and ip-DF ( don't frag bit ) settings, these can shed light within any path-mtu related issues. Ping sweeps starting at a low to high packet size, can also some shed light to a vpn-tunnel mtu issues.
A review of the diag commands that are useful for all firewall engineers using a Fortigate security appliance;
diag debug enable
diag packet sniffer
diag debug app ike
diag vpn tunnel list
NOTE: These are only available from the command line
MISC
Interface based vpns or not?
In this posting we didn't even tap the various different modes of vpns. Within the fortiOS you have 2 possible means for crafting vpns;
1: policy base where we use the key wording "encrypt or ipsec" within a firewall policy action (
fwiw I NEVER EVER use this mode & it's highly recommended not to build you vpns in this fashion )
2: routed mode or commonly known as interface mode (
this the best-common-practice and mode most engineers rely on )
Here's the PROs for the latter ( routed mode )
- you can run a routing protocol over the vpn
- you have a interface to nail policies to just like your ports or wan interfaces
- since we have a interface, we can dump or conduct packet captures over that interface using diagnosic sniffer command
- you can assign ip-address to the inteface
- you have snmp-ifindex , hence now we can graph and monitor with cacti, solarwinds, OpenNMS, and against a interface.
Guess what, if you created the phase1/2 definitions with the phase1-interface and phase2-interface, you are creating a routed-vpn. And the key word, "routed" means you need a static or routing protocol to learn the remote location dst-subnet(s). So this means you need a route to reach the far end dst-subnet(s)
DIAG SNIFFER
The name you give in that phase1-interface configuration, is the same interface you defined for the route gateway and the same interface you can dump on, with the sniffer to capture packets b4 or after encryption.
 NPU issues
You can always disable the NPU from the vpn tunnels if you suspect some weirdness or have concerns with advance acceleration or other off-chip performance. I never recommend this as a permannet fix, since it drives the encrypted traffic directly at the cpu.
Using the full keyword in our show, we can see that we are off-loading to the NPU.
The following screenshot shows some of the crypto stats and these are helpful with eyeballing traffic at the NPU if your model has any VPN acceleration ;
( continuation )
Show-Full
Don't forget, that In all configuration details, the "
show full" command within the sublevels, provides greater details and default settings.
Clearing IKE-gateways
Some times we need to clear a IKE gateway. For good practices, any changes done in you pre-existing vpn tunnels, should be followed by a clearing
By specifying the "clear " and within the
diag vpn ike gateway, we can flush our IKE SA.
And lastly & final
Use the diag debug and flow commands. I 'm providing a few link to my earlier posts & with concerning the easy to execute diagnostics debug flows
http://socpuppet.blogspot.com/2013/03/flow-diagnostic-fortigate.html
http://socpuppet.blogspot.com/2013/06/diag-debug-flow-troubleshooting.html
http://socpuppet.blogspot.com/2013/06/diag-system-session-quick-way-find.html
Execution of the diagnostic debug flow, gives you about 90% of the time, the proper direction to take based on the output followed by the diagnostic flow
- the lack of a fwpolicy
- lack of a forwarding route or uRPF checks failures
- policy ordering issues ( maybe you over look policy ID that denying the traffic & ahead of your fwpolicies for your VPN )
By using the
diagnostic debug flow commands, you can save yourself time, frustration, and wasted tickets to fortinet-support, or posts to online forums.
Ken Felix
Freelance Network/Security Engineer
kfelix at socpuppets .....dot....com
^ ^
=( * * )=
o
/ \